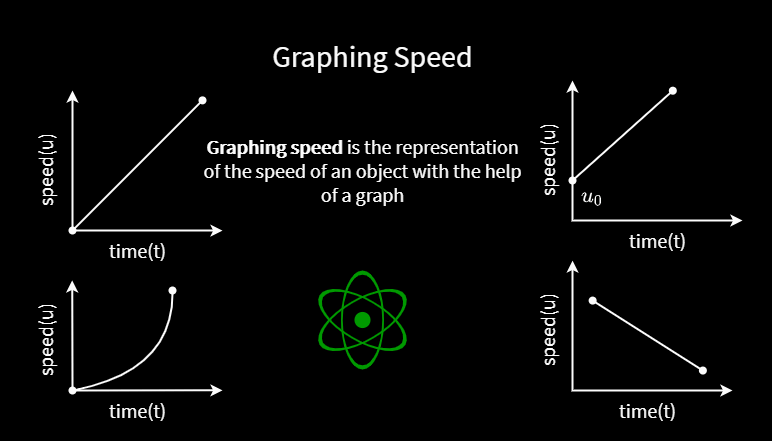
Graphing speed is the representation of the speed of an object with the help of a graph. Before understanding the speed graph, you need to understand the position and time graphs well.
Distance-time Graph
The graph that shows the time t along the x-axis and the distance s by a particle along the y axis is called the distance-time graph of that particle.
The displacement-time graph is obtained by expressing the displacement instead of the distance traveled along the y-axis. And this kind of graph shows how distance is changing over time.
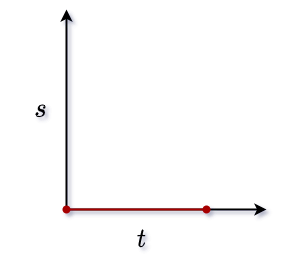
1. Zero Distance
Since there is no question of a distance of a stationary particle, the distance of the particle will always be zero as time goes on.
2. Unifrom Speed
Suppose a particle is moving with a uniform speed. That is, the distance of the particle is always the same in any equal time-space. So in this case, the distance-time graph is a straight line.
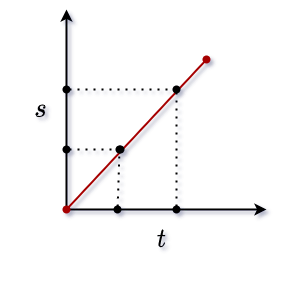
And the tangent of that line along the time axis indicates the speed of that moving object.
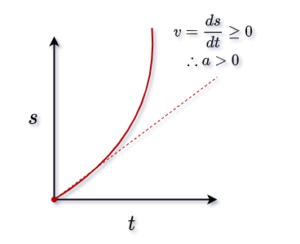
3. Non-Unifrom Speed
If the particle is moving at a non-uniform speed, the acceleration of the particle may or may not be constant.
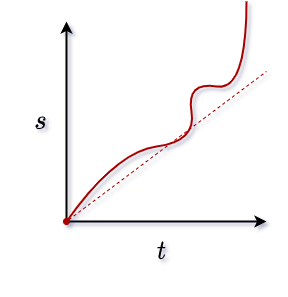
Case1 • If the particle moves at uniform acceleration, its displacement-time graph will be a hyperbola. Notice the image below. If you draw a tangent at each point of the hyperbola, you will notice that the value of speed is different at each point. The speed of that point at that moment is called instantaneous speed.
Case2 • If the particle does not move at uniform acceleration then the graph of the speed-time of the particle will be a curve. And in this case, the tangent drawn at each point of the curve at short intervals will represent instantaneous speed.
Graphing Speed
The graph that shows the time t along the x-axis and speed of a particle along the y axis is called the speed-time graph. And this kind of graph shows how velocity changes over time.
1. u-t graph Constant Speed
The speed-time graph of a particle in constant speed is a straight line parallel to the time axis. The area of the OPQR rectangle bounded by the graph and time axis indicates the value of displacement or distance traveled.
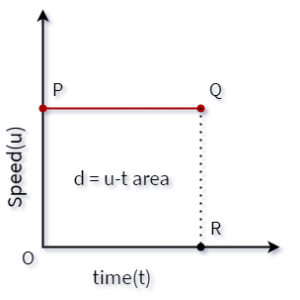
Because the area of rectangle OPQR is = OP×PQ= vt. We know that if a particle moving at a speed of u crosses the distance d at time t, then s = vt
Therefore, the distance traveled = the area of the OPQR rectangle = the area between the line PQ and the time t-axis.
2. u-t graph with non-uniform Speed.
Case1 • Suppose a particle is moving at uniform acceleration. That is, the speed of the particle will remain the same at any equal time interval. So in this case the u-t graph is a straight line with two axes located at specified angles. So, look at the graph below
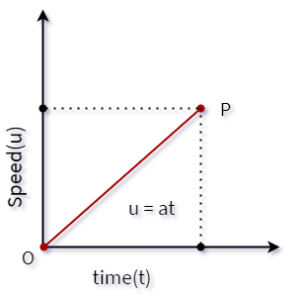
And the tangent of the ob straight line along the time axis indicates the uniform acceleration of that moving object. E.g.
Therefore, we can say that the tangent of the u-t graph will be the amount of acceleration of the particle. And the straight line will indicate the motion of the particle with uniform acceleration.
Case2 • When the particle starts its journey from a stationary state, the straight line goes to the origin. And, if the particle has an initial speed, then the straight line does not go to the origin.
So, notice this figure below, here the particle first moves along the t-axis with constant speed uo and after the specified move the particle is moving at a uniform speed.
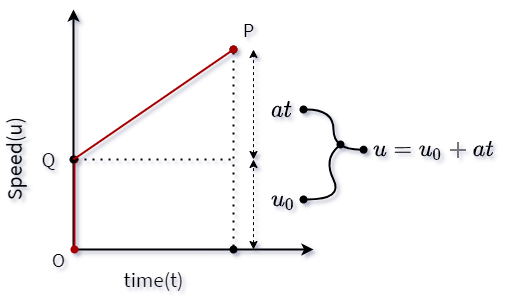
In both cases, the area between the speed-time graph and the time-axis indicates the value of the distance traveled by the object.
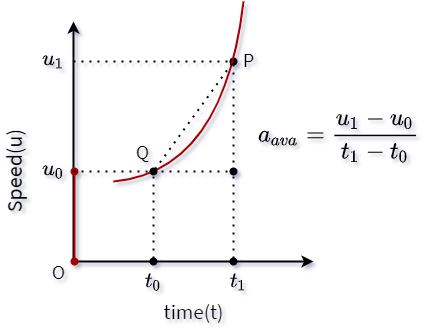
Case3 • The speed-time graph will be a curve if the object particle moves at unequal acceleration. Just like before, the average acceleration of the particles of an interval of t1-t0 time will be equal to the tangent of QP chord.
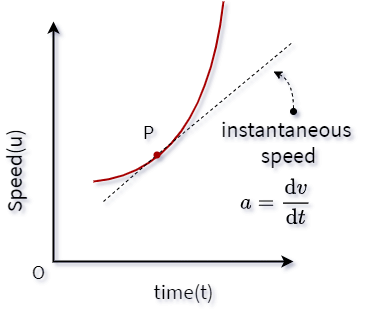
And in this case, if you draw a tangent at any point on the curve, that tangent will define instantaneous acceleration.
And also with the help of calculus, it is shown that even in the case of an object moving at unequal acceleration, the distance of the particle at any given time is equal to the area between the curve and the time-axis.
Conclusion
Here the graphing speed is fully described with the help of Speed Time Graph. As a result, it will help you to understand how speed changes over time. Even then, if there is any difficulty in understanding, then let us know your problem in the comment box. Thank you